This blog post will be about analyzing the use of regression models in the context of a real world problem! Our dataset is Tornadoes in the US from 1950-2021
Sections:
- Exploring the dataset and deciding the problem
- Preprocessing & our models
- Random Forest
- Multiple Linear w/ Polynomial, Backwards Elimination
- SVR
- Analyzing Results & Conclusions
This is all of the code I used. https://github.com/jhmejia/blog-notebooks/tree/data-mining
Exploring the Dataset and Deciding the Problem
Overall: Tornadoes frequently occur in the United States, resulting in vast destruction and often injuries and death. They occur more often in the United States and Canada than in other countries with the most tornado-prone regions in the US being the central and southeastern states along a corridor sometimes called "Tornado Alley."
A tornado's destructiveness is derived largely from the wind speed within it. For this reason, meteorologists rate tornadoes using a scale based on wind speed.
Here is a link to the dataset: https://www.kaggle.com/danbraswell/us-tornado-dataset-1950-2021
For context, let's visualize the data:
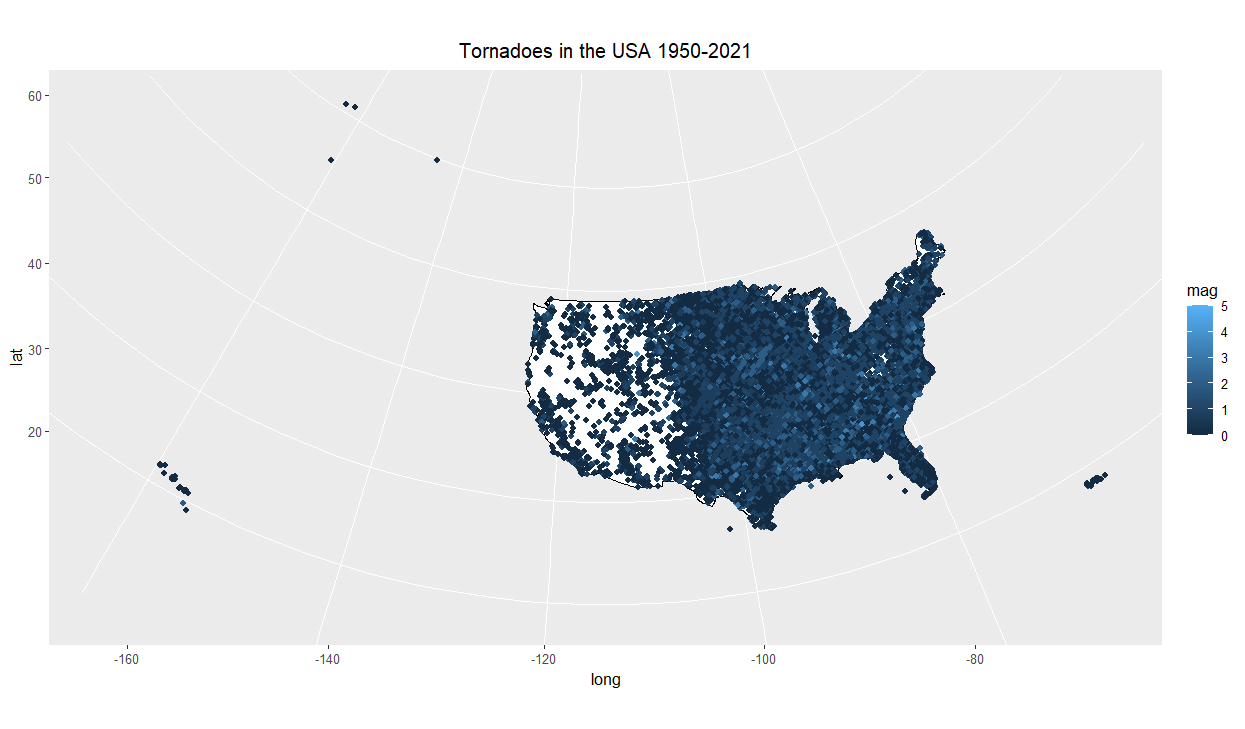
That's a lot of tornadoes!
As a quick exploration of the data, we have the following columns:
- yr - 4-digit year
- mn - Month (1-12)
- dy - Day of month
- date - Datetime object (e.g. 1950-01-01)
- st - State where tornado originated; 2-digit abbreviation
- mag - F rating thru Jan 2007; EF rating after Jan 2007 (-9 if unknown rating)
- inj - Number of injuries
- fat - Number of fatalities
- slat - Starting latitude in decimal degrees
- slon - Starting longitude in decimal degrees
- elat - Ending latitude in decimal degrees (value of 0 if missing)
- elon - Ending longitude in decimal degrees (value of 0 if missing)
- len - Length of track in miles
- wid - Width in yards
This is a lot of data, so we will be tuning this down later on. However, first it is important to define the problem somewhat formally.
The problem is to create a model that can accurately predict the number of victims, including injuries and fatalities, for each tornado, given other factors about the tornado as input. This requires the use of data mining and statistical techniques to analyze historical data on tornadoes and their associated damages.
The model's performance will be evaluated based on its ability to accurately predict the number of victims for a new, unseen tornado, using appropriate metrics such as mean squared error or R-squared.
Now, let's get started!
Preprocessing & Our Models
An important part of the process to do regression is preprocessing. This involves getting rid of unnecessary columns, 'massaging' the data, scaling it, and replacing unknowns.
When I did this, I decided to do the following:
- Encoded ‘date’ columns into ‘season’
- This is because we wanted to find ‘tornado season’ so I used the month. (dec-feb = winter, mar-may = spring, etc.) Year and day were unnecessary because those are not factors that affect the season.
- Dropped ‘state’ column
- This is irrelevant- lat and long already exist.
- Replaced unknowns with average
- Specifically, for ending lat, lon, magnitude, there are some unknowns. We learned this inside the dataset. To replace it, you replace it with the average of the knowns. You can also use median if you want. I tried mean and median but there was an insignificant difference)
- To get our statement, we made a new Y column
- I combined ‘fatalities’ and ‘injuries’ into a new column ‘vic’ (VICTIMS)
- Finally, I put 80% of data into training
- The reason we need a training and test set is so we can evaluate how accurately the model predicts the data. If you just have 1 set, it's possible you can have overfitting etc.
- No set seed- ran each model many times, took average r2
- A 'set seed' means that the 80% of the data will always be the same 80%. In order to have a more robust model, I ran each model many times and found the average metrics.
- Mag (magnitude)
- Slat (starting latitude)
- Slon (starting longitude)
- Elat (ending latitude)
- Elon (ending longitude)
- Season (1, 2, 3, 4, encoded.)
- Len (Track length)
- Wid (width)
- Vic (victims = injuries + fatalities)
This article demonstrates how R can be effectively used for regression analysis and predictive modeling using both linear and random forest techniques. Comparing traditional statistical approaches with ensemble learning methods helps learners better understand model accuracy, feature importance, and data-driven decision making. Students interested in practical analytics implementation can also explore R Programming Projects to build real-world machine learning and statistical applications.
ReplyDeleteRegression and predictive analytics continue to play a major role in finance, healthcare, business intelligence, and research-oriented systems. Learners looking to expand their knowledge in intelligent analytical models can further refer to Regression Projects for advanced ideas involving forecasting, classification, and performance evaluation using modern machine learning techniques. This post is a great learning resource for data science enthusiasts working with R.
ReplyDelete